
The Consumer Price Index (CPI), which measures the change over time in prices of goods and services consumed by households, is calculated by the Turkish Statistical Institute (TURKSTAT) in compliance with the European Union (EU) standards. As of January 2026, TURKSTAT introduced methodological changes in three pillars of the CPI calculation as part of compliance with international criteria. These can be listed as: change in the classification of consumption expenditures, revision of the CPI base year as 2025, and adoption of the “System of National Accounts Household Final Consumption Expenditures” as the main source of data in determining expenditure weights. In this blog post, we explore the implications of these changes for the CPI.
Change in Classification and Base Year
In the former classification, expenditure items were categorized under 12 major groups, 43 subgroups, and 407 products. However, as consumption habits changed and product diversity increased over time, some categories lost their actuality. Moreover, it became difficult to classify new products and services. Therefore, a new classification was adopted that was created by the United Nations and mandated in EU countries.[1]
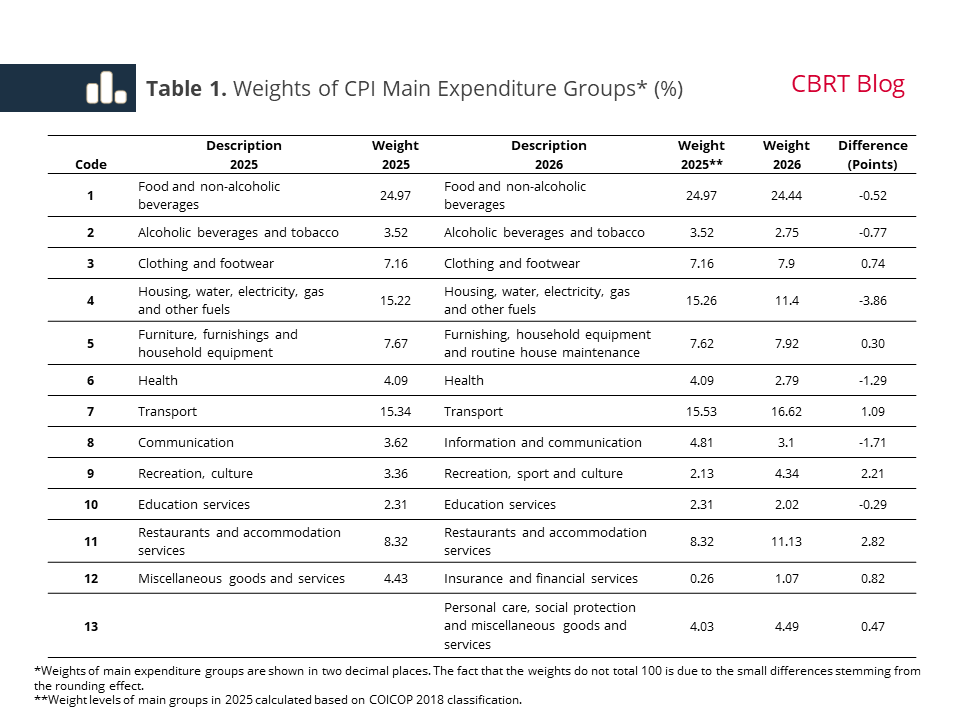
The new classification introduced a higher number of categories to better reflect the current consumption structure, while offering a clearer distinction between goods and services. Moreover, online services (fees for food delivery services etc.) and new consumption patterns (charging of electric cars, dryers, etc.) were also covered. In addition, expenditure items were re-arranged under 13 main groups, instead of the former 12 main groups (Table 1). Due to its heterogeneity, the “Miscellaneous Goods and Services” group was split into two divisions, and some items were re-classified under “Insurance and Financial Services” and “Personal Care, Social Protection and Miscellaneous Goods and Services” headings. Furthermore, the scope of the “Communication” and “Recreation and Culture” groups was expanded to be re-classified as “Information and Communication” and “Recreation, Sport and Culture”, respectively.
Simultaneous with the change in classification, the base year for the CPI was also revised as 2025. Rescaling of the index according to the new base year does not affect previous monthly and annual inflation rates.
Change in Weights
In the former classification, weights used to be calculated by expanding the expenditure and turnover data obtained from the Household Budget Survey, the institutional population survey, the tourism survey, and administrative records with the rates of change in National Accounts Household Final Consumption Expenditure data. The new classification also brought about a change in the data sources used to determine CPI weights. Accordingly, the “System of National Accounts Household Final Consumption Expenditures” data has become the primary source of data to calculate consumption shares, while “Household Budget Surveys” began to be used as a supplementary source (in subcategory weights). Regular updates to national accounts allow changes in consumption patterns to be reflected faster. This approach ensures a consistent relationship between the CPI and macroeconomic indicators related to price changes, such as the GDP deflator.
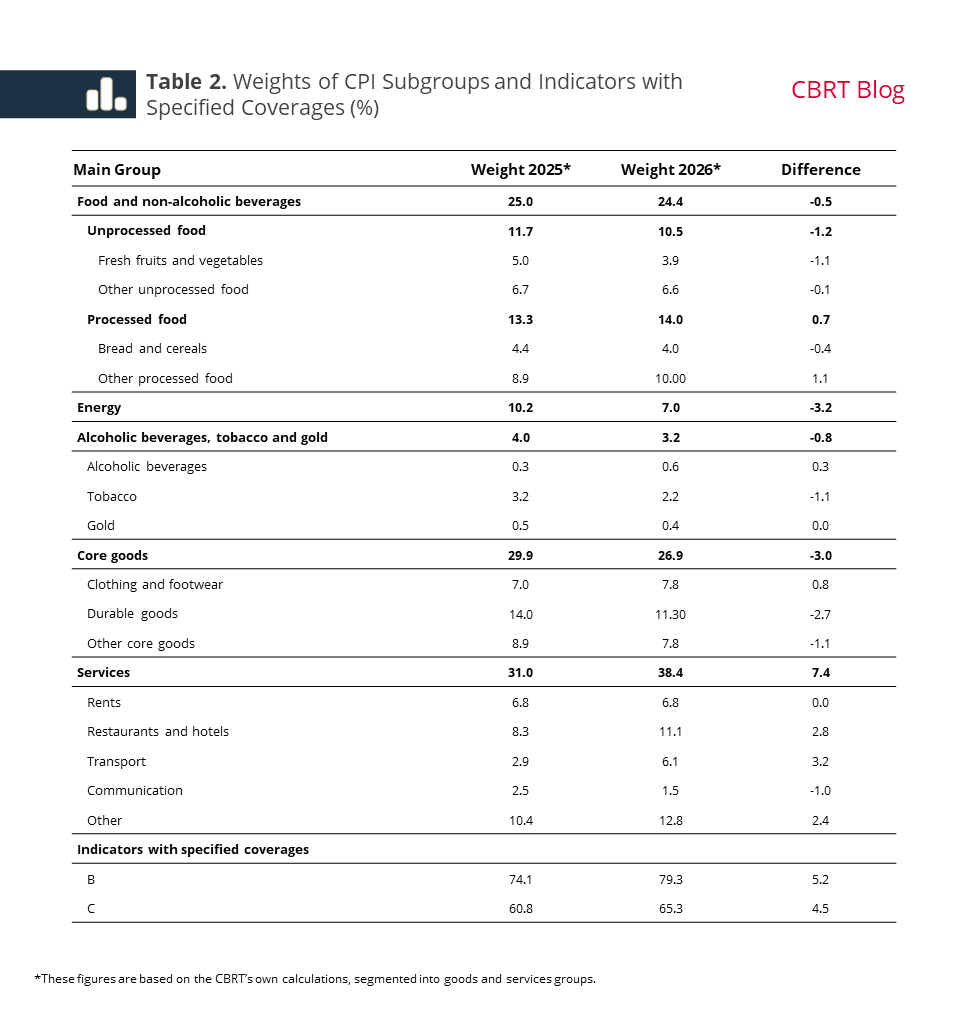
An analysis of weights based on CPI subitems and indicators with specified coverages reveals that the most significant change is in the services sector. In line with consumption patterns and structural transformation in the economy, there is an increase of 7.4 points in the share of the services sector (Table 2). Transport services, restaurants and hotels, and other services are at the forefront of this increase. Besides, there is also an increase in the consumption share of recreation, sport, and culture, as well as financial services. This is consistent with the increase in the share of the services sector in the national income data, reflecting the convergence to advanced economies. A shift towards services is also observed in consumption expenditures. There is a similar increase in services employment, as well. In this respect, it is safe to say that the change in the composition of the CPI is consistent with other macro indicators.
Despite the increase in the weight of the services group, the weights of other main categories are on the decline compared to 2025. The most significant decline is in the energy group, with 3.2 points. In addition to municipal water, this group's standout items are electricity and natural gas, both of which are partly driven by subsidies. There is a decline of 3.0 points in the weight of core goods in 2026. This is led by durable goods. Although there is a limited decline in the weight of the food group, differentiation prevails across subgroups. The weight of unprocessed food decreased due to fresh fruits and vegetables, while the weight of processed food increased. All in all, the weights of the B and C indicators rose by 5.2 and 4.5 points to 79.3% and 65.3%, respectively.
As for the main expenditure groups at the two-digit level, the largest decrease in weights compared to previous year, was observed in housing, water, electricity, gas and other fuels, followed by information and communication, and health. The most significant increases in weights were observed in restaurants and accommodation services, as well as recreation, sport and culture, reflecting shifts in consumption patterns. Meanwhile, changes in weights across the other main expenditure groups remained relatively limited (Table 1).
Impact Analysis
In this section, we measure the impact of the change in weights on January 2026 inflation. The most comprehensive price indices published by TURKSTAT are available at the five-digit level. Accordingly, we conducted calculations at the five-digit level using both the old and the new weights. These calculations indicate that the change in the index’s weighting structure has an approximately 0.1 points dampening effect on January inflation.
In 2025, annual goods inflation stood at 25%, while annual services inflation was 44%. Given that services inflation in 2026 may be higher than goods inflation, the increase in the weight of services have the potential to push this year’s inflation rate higher. On the other hand, the same as in in 2025, the annual services inflation is likely to decline faster than the goods inflation in 2026. Therefore, when these two effects are considered together, it is predicted that the upward impact of the change in services weighting on annual inflation will be approximately 1 percentage point.
[1] COICOP 2018, the most recent version of consumption expenditures classification, has been adopted. COICOP stands for “Classification of Individual Consumption According to Purpose”.